Highest Resolution Electrical Measurements

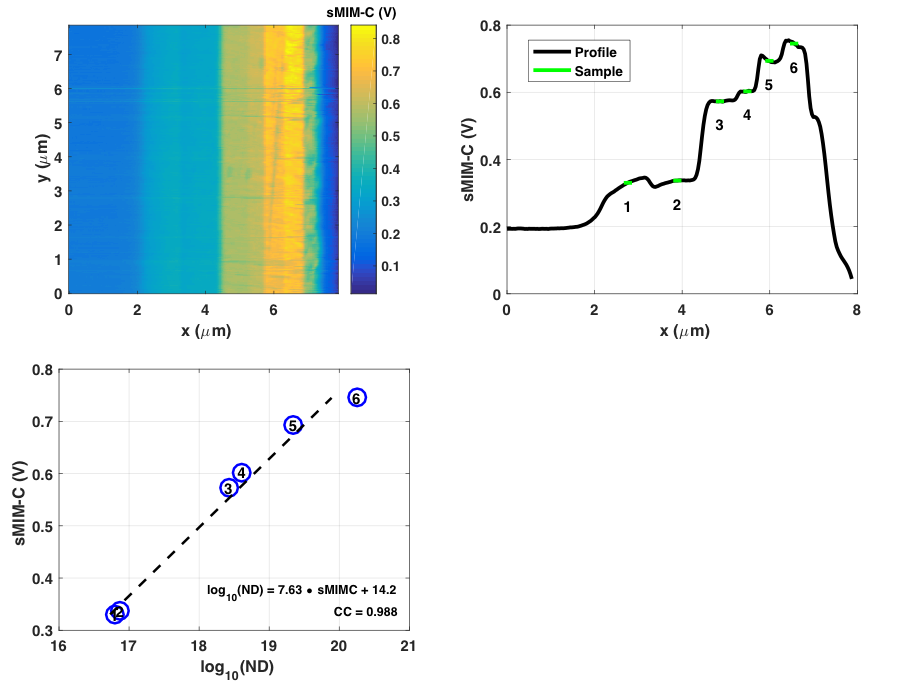
Quantitative Measurement of Doped Cross-section Reference Sample
a) A processed sMIM-C image of an n-type IMEC staircase. b) The average profile with “calibration samples” highlighted in green. c) Plot of the sMIM-C calibration values vs. the published values of log doping. The linear fit is a calibration that can be applied to subsequent unknown doped samples.
Copyright 2024. All Rights Reserved