Highest Resolution Electrical Measurements

Specific-site sMIM nano C-V Analysis
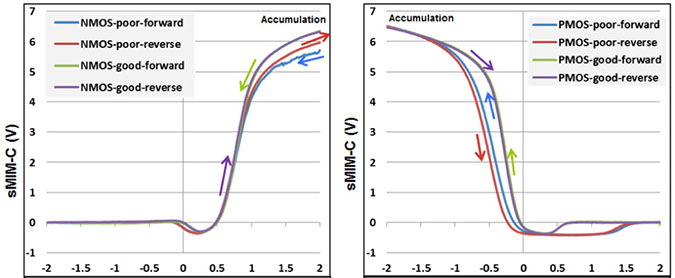
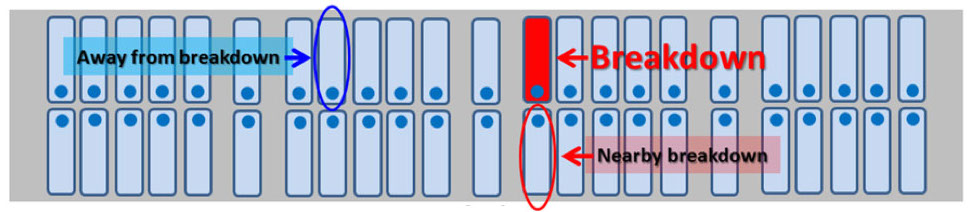
Site specific locations where sMIM measures locations nearby the breakdown site and compare with good locations that are away from the breakdown site. The nano C-V curve near a breakdown location clearly shows abnormal capacitance drop above 0.8V when compared to the C-V curve of the good site (away from the breakdown site). The good NMOS C-V shows larger capacitance at accumulation region than the nearby breakdown site NMOS which may have similar symptoms and correlations to the breakdown site. The C-V hysteresis behavior was found on the devices near the breakdown location.
Copyright 2024. All Rights Reserved