ScanWave Pro™ E - Breakthrough in Scanning Microwave Microscopy (ScanWave™)
KEY FEATURES
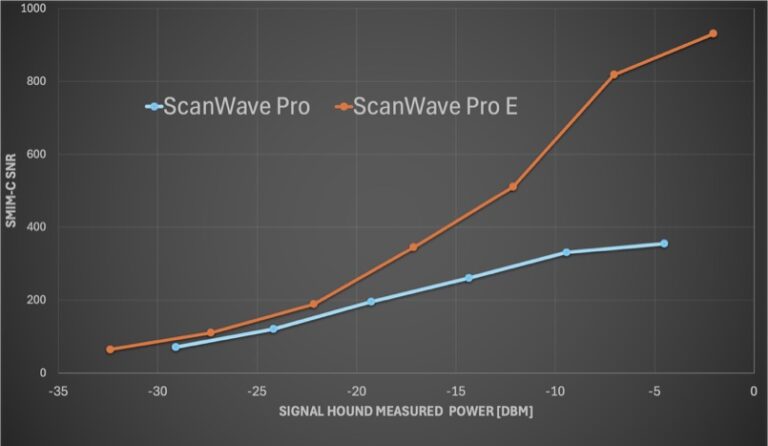
Improved S/N by over 300% compared to ScanWave ProTM
Comprehensive system optimization in 3-4 seconds
Probes, PIM, Cables, electronics
In-situ system optimization resulting in significantly improved performance (S/N, spatial resolution etc.)
Software speed improved by 10-15x
Breakthrough sensitivity of < 0.075 aF
Nanoscale spatial resolution
Less than 10 nm lateral resolution
High power for subsurface imaging
Depth range > 200 nm
Proprietary shielded probes
Streamlined probe exchange and optimization
BENEFITS
Significant ease of use improvement for most advanced electrical AFM mode
Measure variations in permittivity and conductivity (ε & σ) at the nanoscale
Multiple AFM modes supported
Characterize a variety of electrical properties
Little to no sample preparation required
Electrical measurements on insulating substrates
Subsurface imaging for buried structures
Tool-less probe exchange
Bruker, Park and Asylum AFMs
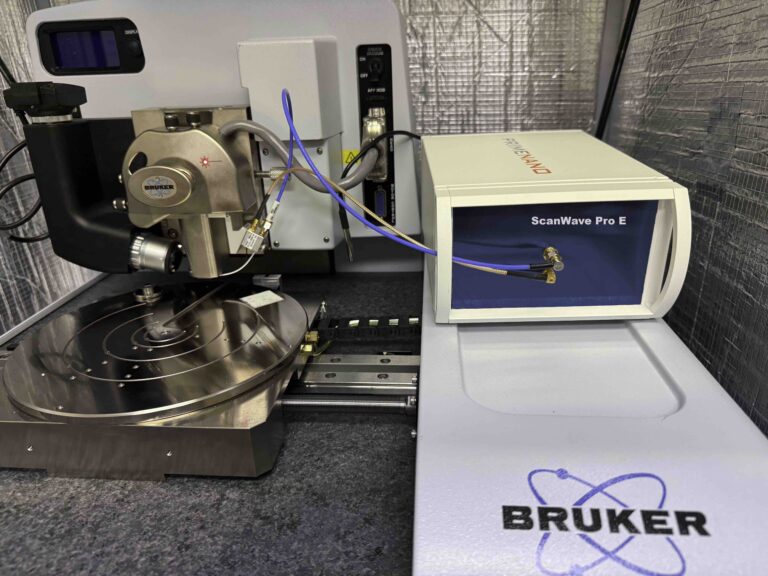
ScanWave Pro™ E
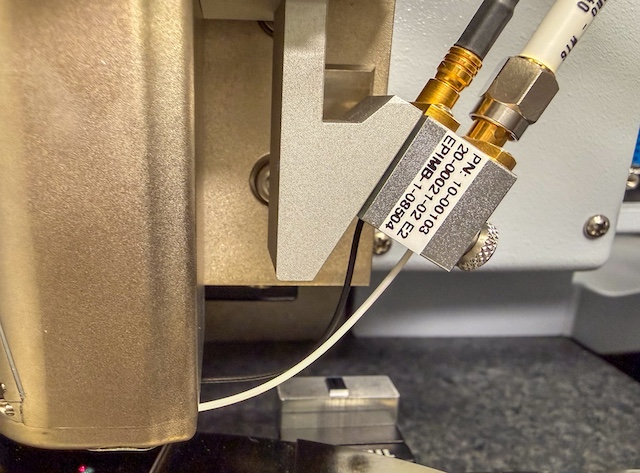
Tool less electronic probe holder
Signal to Noise improvement
INNOVATION AND IMPROVEMENTS
Signal-to-Noise Improvements
PrimeNano optimized the world-class ScanWave ProTM electronics design, significantly enhancing the Signal-to-Noise (S/N) performance of ScanWave ProTM E.
Usability, Automation and Software Improvements
ScanWave ProTM E offers vastly improved usability. We have enhanced all software functions by a factor of 10X to 15X.
Standard optimization functions are now measured in single-digit seconds, enabling entirely new usage models and significantly improving practicality and productivity for commercial applications.
In Situ Optimization of System
ScanWave ProTM E facilitates in-situ automated software optimization of your complete setup within seconds. This ensures that the system operates at its optimal configuration consistently and also eliminates the human factor in the measurement setup.
APPLICATION EXAMPLES
Highest Sensitivity Subsurface Imaging
ScanWave ProTM E boasts a 300% increase in signal-to-noise ratio (SNR) compared to ScanWave ProTM, and around 10x increase in SNR compared to ScanWave 2.0TM.
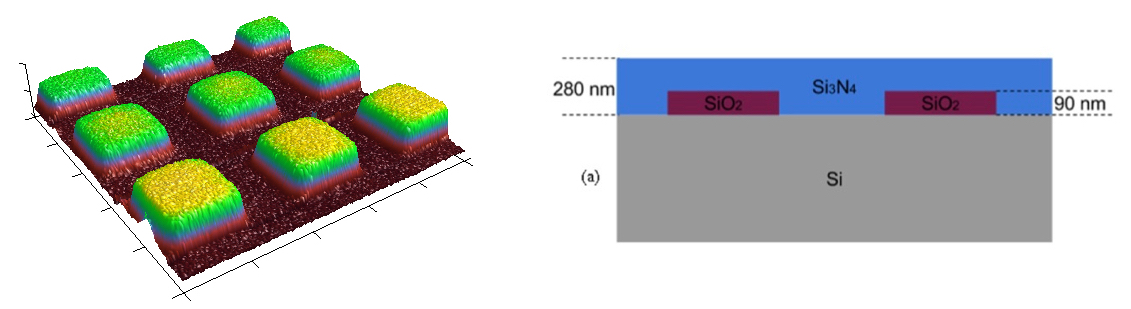
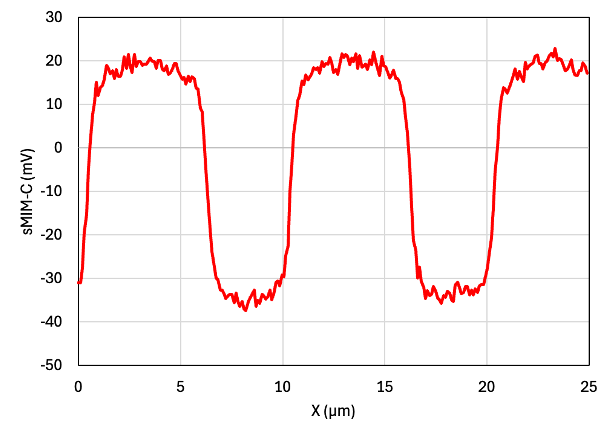
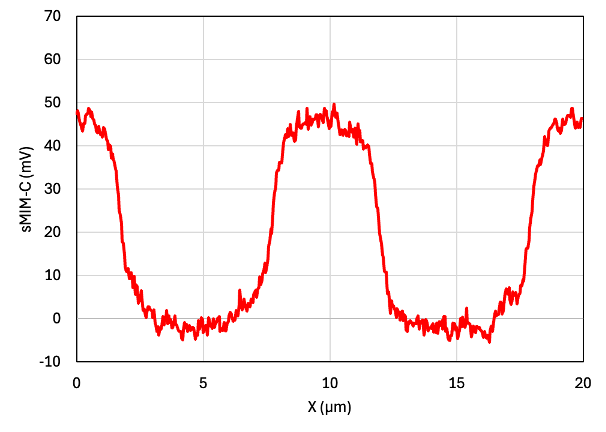
Figure 1 shows sMIM-C imaging of a repeating SiO2 structure buried beneath 190 nm of Si3N4, performed with the ScanWave ProTM E. Figure 2 and 3 show ScanWave ProTM E achieves a superior image with clearer features due to its improved SNR performance.
Figure 1 ScanWave ProTM E image of buried SiO2 structures
Figure 2 ScanWave ProTM E
FIgure 3 ScanWave Pro TM
Rapid, Selective Probing of Dopant Polarity & Concentration (SRAM images)
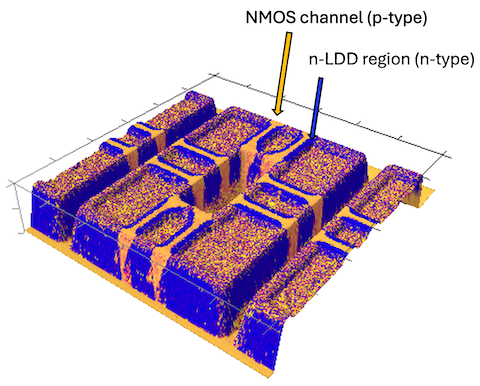
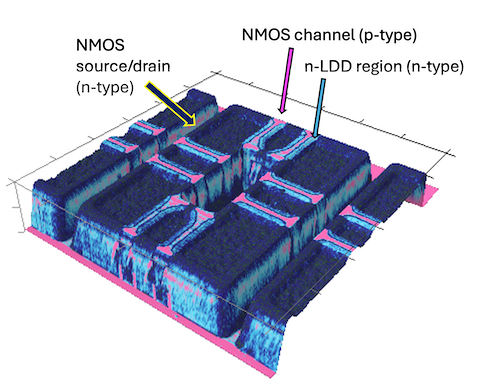
By applying additional tip biases during sMIM measurements, the ScanWave ProTM E can probe samples for dopant polarity (dC/dV Phase) and dopant concentration (dC/dV Amplitude). Moreover, the dC/dV measurements can be tuned to specifically and separately probe n-type and p-type dopants.
Figure 4 is a 3D topography image of an SRAM sample with dC/dV Phase color mapping showing clear identification of n-type (blue) and p-type (yellow) regions of the device. Figure 5 is the same 3D topography image instead with dC/dV Amplitude color mapping, probing n-type (light & dark blue) and p-type (pink) regions selectively based on dC/dV measurement parameters.
Figure 4 SRAM dC/dV Phase
Figure 5 SRAM dC/dV Amplitude
Nanometer-scale Resolution for Semimaterials
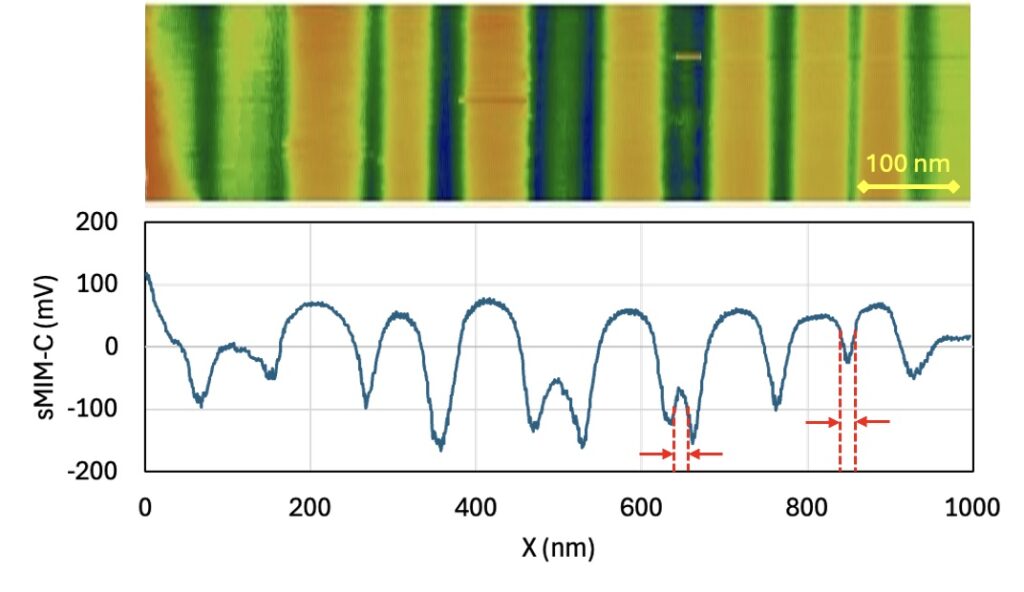
The ScanWave ProTM E can reliably resolve structures on the order of 10 nm with scan times of only a few minutes. Figure 6 shows a 1 µm x 200 nm sMIM-C image of stacked layers of SiO2 and doped Si of varying layer widths. The linescan data clearly depicts layers as thin as 12 nm and 15 nm, identified via FWHM of peaks and valleys.
Figure 6 ScanWave Pro™ E Imaging of Stacked Layer Sample
ScanWave ProTM E vs ScanWave ProTM Feature Comparison
Feature
ScanWave ProTM E
ScanWave ProTM
Performance
Signal-to-Noise Improvement vs SWP
300%
━
Installation
Independent of 3rd Party Software
✔
✖
Reduced Install File Size
125 MB
650 MB
Software - Ease of Use/Performance
PMI Optimization On Load Station
4 seconds
40 seconds
PIM and Setup Optimization on System
4 seconds
✖
Auto Demod Phase
2 minutes
✖
Calibration
2 minutes
20 minutes
Reflectometer Mode
7 sweeps/second
0.5 sweeps/second
Auto PIM Tune
20 seconds
✖
R/C Channel Swap
✔
✖
Editable Calibration
✔
✖
Continuous R/C Channel Display (Zoomable)
✔
✖
Instant Parameter Optimization
4
✖
Want to Upgrade to ScanWave ProTM E?
For a limited time, we will upgrade your system to the newest ScanWave ProTM E. Please contact us for details.